Chapter 2 Extract data within a boundary
notebook filename | 02-sanctuary.Rmd
history | converted to R notebook from sanctuary.R
In this exercise, you will download data from within the boundaries of the Monterey Bay National Marine Sanctuary (MBNMS) and visualize the data in a map.
The exercise demonstrates the following skills:
- Using rerddap to retrieve information about a dataset from ERDDAP
- Using the rxtractogon function to extract satellite data within an polygon over time
- Mapping satellite data
2.1 Install packages and load libraries
pkges = installed.packages()[,"Package"]
# Function to check if pkgs are installed, install missing pkgs, and load
pkgTest <- function(x)
{
  if (!require(x,character.only = TRUE))
  {
    install.packages(x,dep=TRUE,repos='http://cran.us.r-project.org')
    if(!require(x,character.only = TRUE)) stop(x, " :Package not found")
  }
}

# create list of required packages
list.of.packages <- c("ncdf4", "rerddap","plotdap","rerddapXtracto", "parsedate",
                      "sp", "ggplot2", "RColorBrewer",
                      "reshape2", "maps", "mapdata", "jsonlite")

# Run install and load function
for (pk in list.of.packages) {
  pkgTest(pk)
}

# create list of installed packages
pkges = installed.packages()[,"Package"]
2.2 Load sanctuary boundary coordinates
The rerddapXtracto package comes with the dataset mbnms which conatains the longitude and latitude values for the boundary of the Monterey Bay National Marine Sanctuary. These coordinates draw the the boundary of the sanctuary on a map, like tracing a dot-to-dot drawing. Take a quick look at the contents of this data variable.
## 'data.frame':    6666 obs. of  2 variables:
##  $ Longitude: num  -123 -123 -123 -123 -123 ...
##  $ Latitude : num  37.9 37.9 37.9 37.9 37.9 ...
Additional sanctuary boundaries may be obtained at http://sanctuaries.noaa.gov/library/imast_gis.html.
The script below:
- Extracts the longitude and latitude data into vector variables
2.3 Select the chloropyll dataset
For this example we will use 750 m VIIRS monthly chlorophyll dataset (ID erdVHNchlamday)
The script below:
* Gathers information about the dataset (metadata) using rerddap
* Displays the information
# Use rerddap to get dataset metadata
dataInfo <- rerddap::info('erdVHNchlamday')  # N. Pacific 750 m VIIRS chl
# Display the metadata
dataInfo
## <ERDDAP info> erdVHNchlamday
## Base URL: https://upwell.pfeg.noaa.gov/erddap/
## Dimensions (range):
## time: (2015-03-16T00:00:00Z, 2019-09-16T00:00:00Z)
## altitude: (0.0, 0.0)
## latitude: (-0.10875, 89.77125)
## longitude: (-180.03375, -110.00625)
## Variables:
## chla:
## Units: mg m^-32.4 Set the options for rxtractogon
- Use the name of the chlorophyll parameter that was displayed above in dataInfo: parameter <- “chla”
- The metadata from dataInfo also shows you that this variable has a altitude coordinate that equals zero. Set the value of the time coordinate to zero: zcoord <- 0.
- The time variable passed to xtracogon must contain two elements, the start and endpoints of the desired time period.
- This example makes use of the “last” option of ERDDAP to retrieve data from the most recent time step.
- The “last’ option also accepts the”-" operator. To request the time step with the second most recent data use “last-1”.
- In the script below the time variable (tcoord) is defined as tcoord <- c(“last-1”, “last”)
- This example makes use of the “last” option of ERDDAP to retrieve data from the most recent time step.
2.5 Extract data and mask it using rxtractogon
- Set the arguments within the rxtractogon function using the dataset information (dataInfo), the longitude (xcoord) and latitude (ycoord) vectors from the CSV file, the time (tcoord) vector and altitude (zcoord) variable.
- Then run rxtractogon to extract data from the “erdVHNchlamday” dataset and mask out data not falling within the MBNMS boundary.
- List the data
## Request the data
sanctchl <- rxtractogon (dataInfo, parameter=parameter, xcoord=xcoord, ycoord=ycoord,tcoord=tcoord,zcoord=zcoord)
## Registered S3 method overwritten by 'httr':
## method from
## print.cache_info hoardr## List of 6
## $ chla : num [1:272, 1:311, 1:2] NA NA NA NA NA NA NA NA NA NA ...
## $ datasetname: chr "erdVHNchlamday"
## $ longitude : num [1:272(1d)] -123 -123 -123 -123 -123 ...
## $ latitude : num [1:311(1d)] 35.6 35.6 35.6 35.6 35.6 ...
## $ altitude : num [1(1d)] 0
## $ time : POSIXlt[1:2], format: "2019-08-16" "2019-09-16"
## - attr(*, "class")= chr [1:2] "list" "rxtracto3D"The extracted data contains two time periods of chlorophyll data within the sanctuary boundaries.
2.6 Select just one time period, the second one.
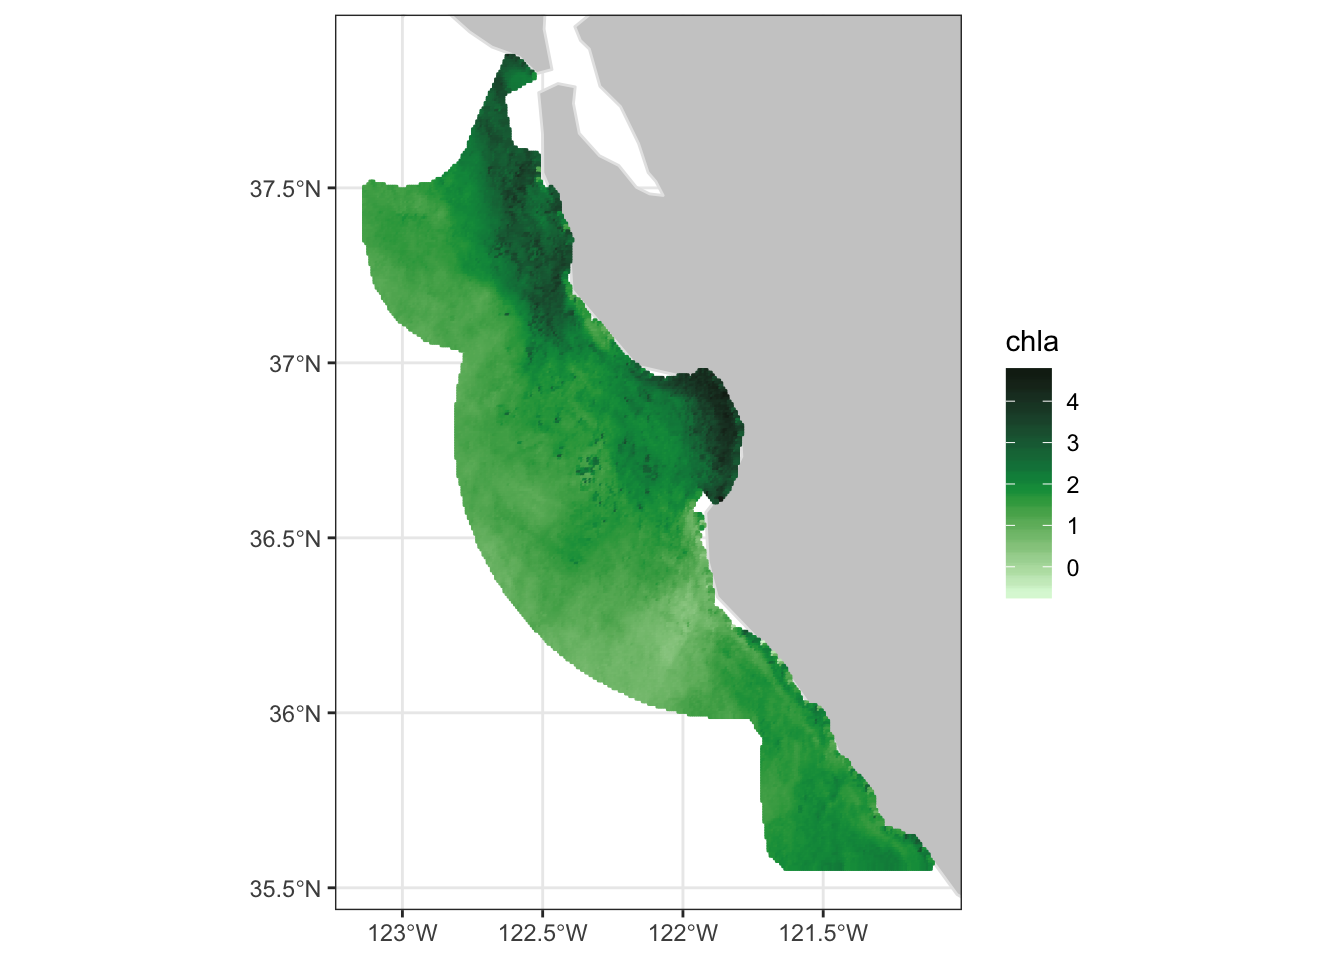
2.6.1 Plot the data
- Use the plotBBox function in rerddapXtracto to quickly plot the data

2.6.2 Apply a function to the data
myFunc <- function(x) log(x)
plotBBox(sanctchl1, plotColor = 'chlorophyll',maxpixels=100000, myFunc=myFunc)